Clustring using t-SNE and K-Means Algorithm
Problem Statement
t- distributed Stochastic Neighbour Embedding is a machine learning algorithm. It is non-linear dimensionality reduction technique well suited for embedding high-dimension data for visualization in a low-dimension space of two or three dimensions. t-SNE often provides early insights on whether the data is separable or not. Because in unsupervised learning the target variable is unknown and there can be several unknown classes about which information or knowledge is minimum. So, clustering approach can be implemented to counter this problem.
Solution
- Applying t-SNE to whole dataset having 11 classes was not the best choice as it would lead inaccurate clusters formation.
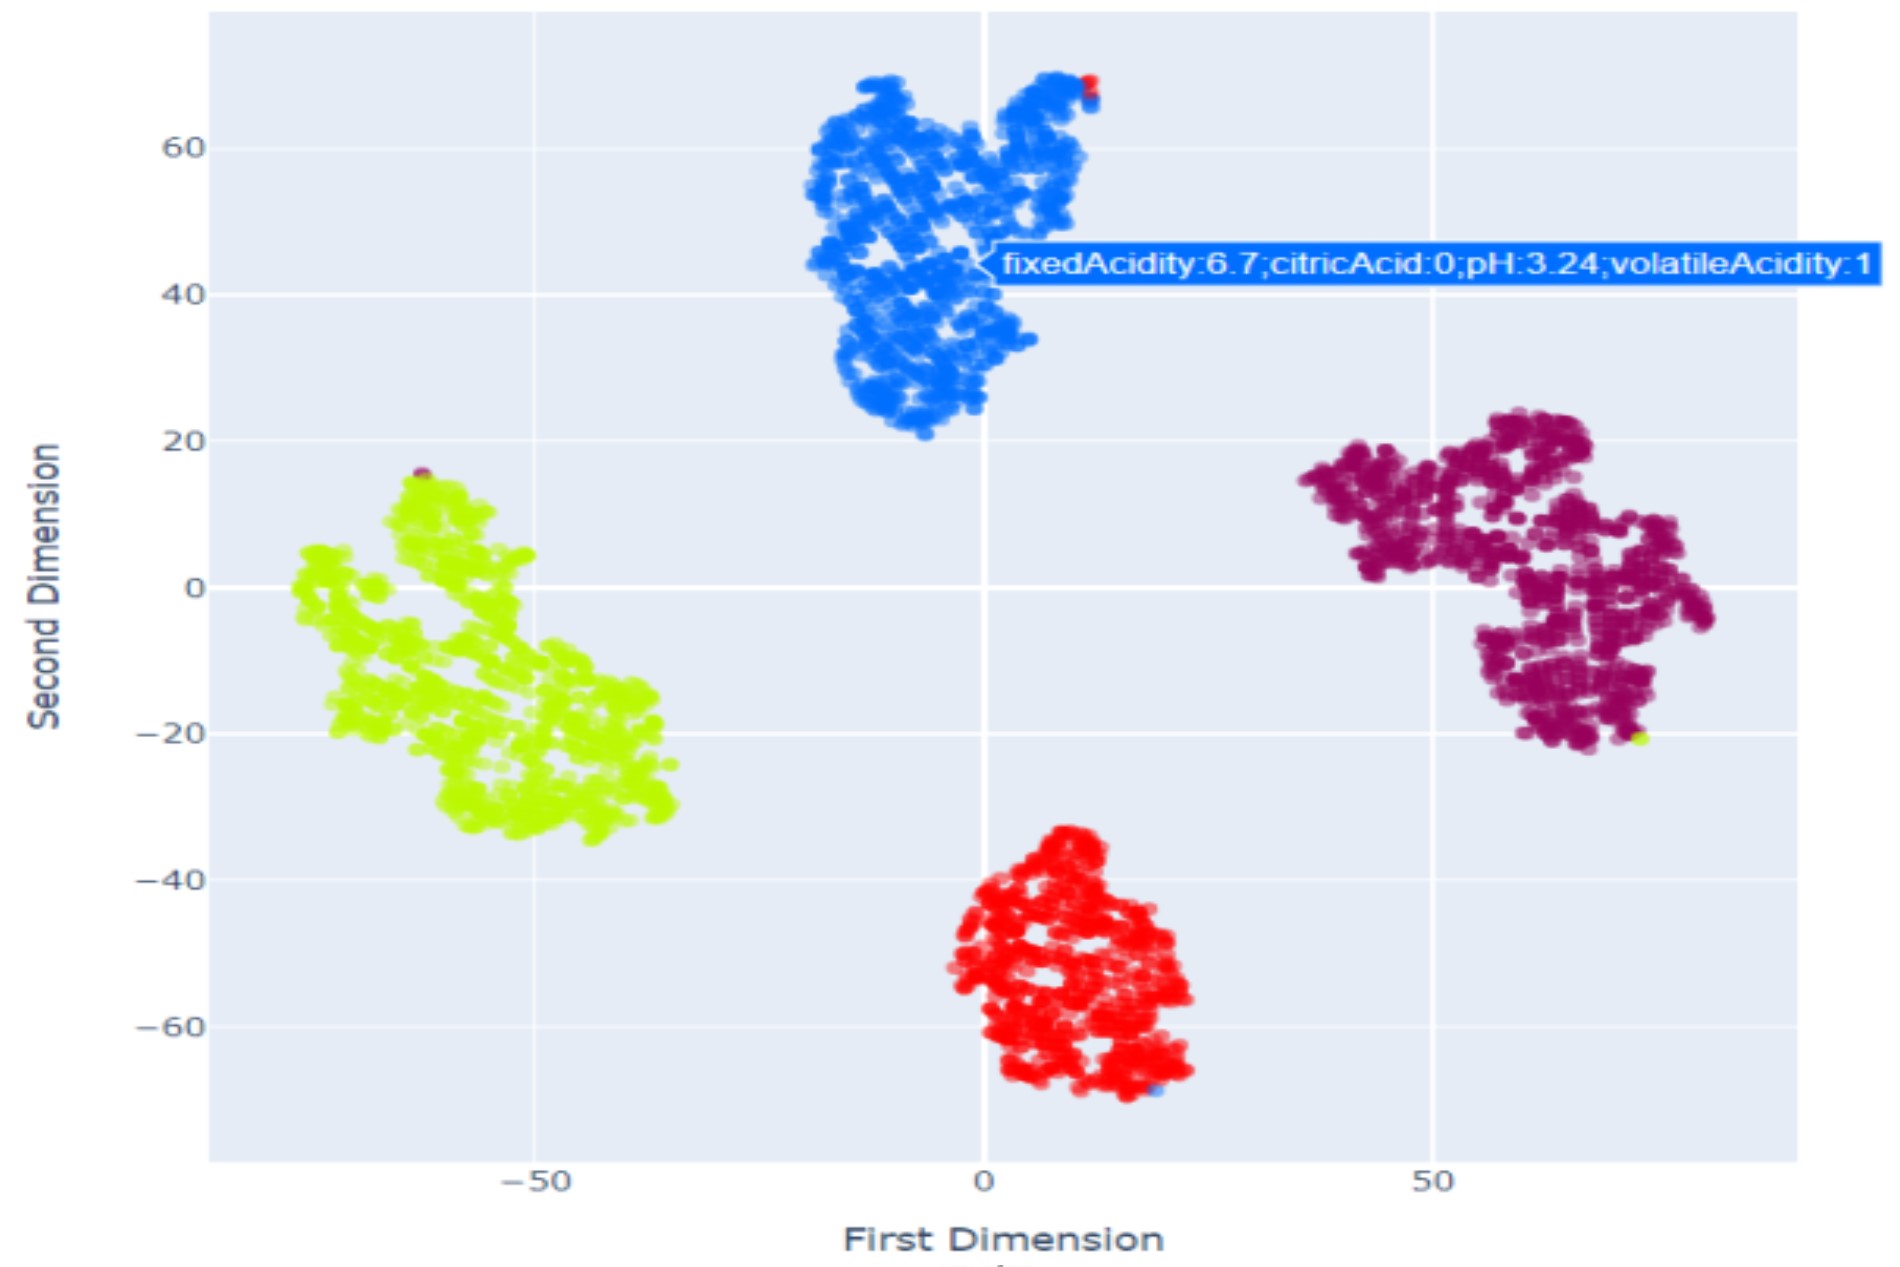
- Hence, dataset was divied into 3 subset: Subset1 – Fixed Acidity, Volatile Acidity, Citric Acid, pH,
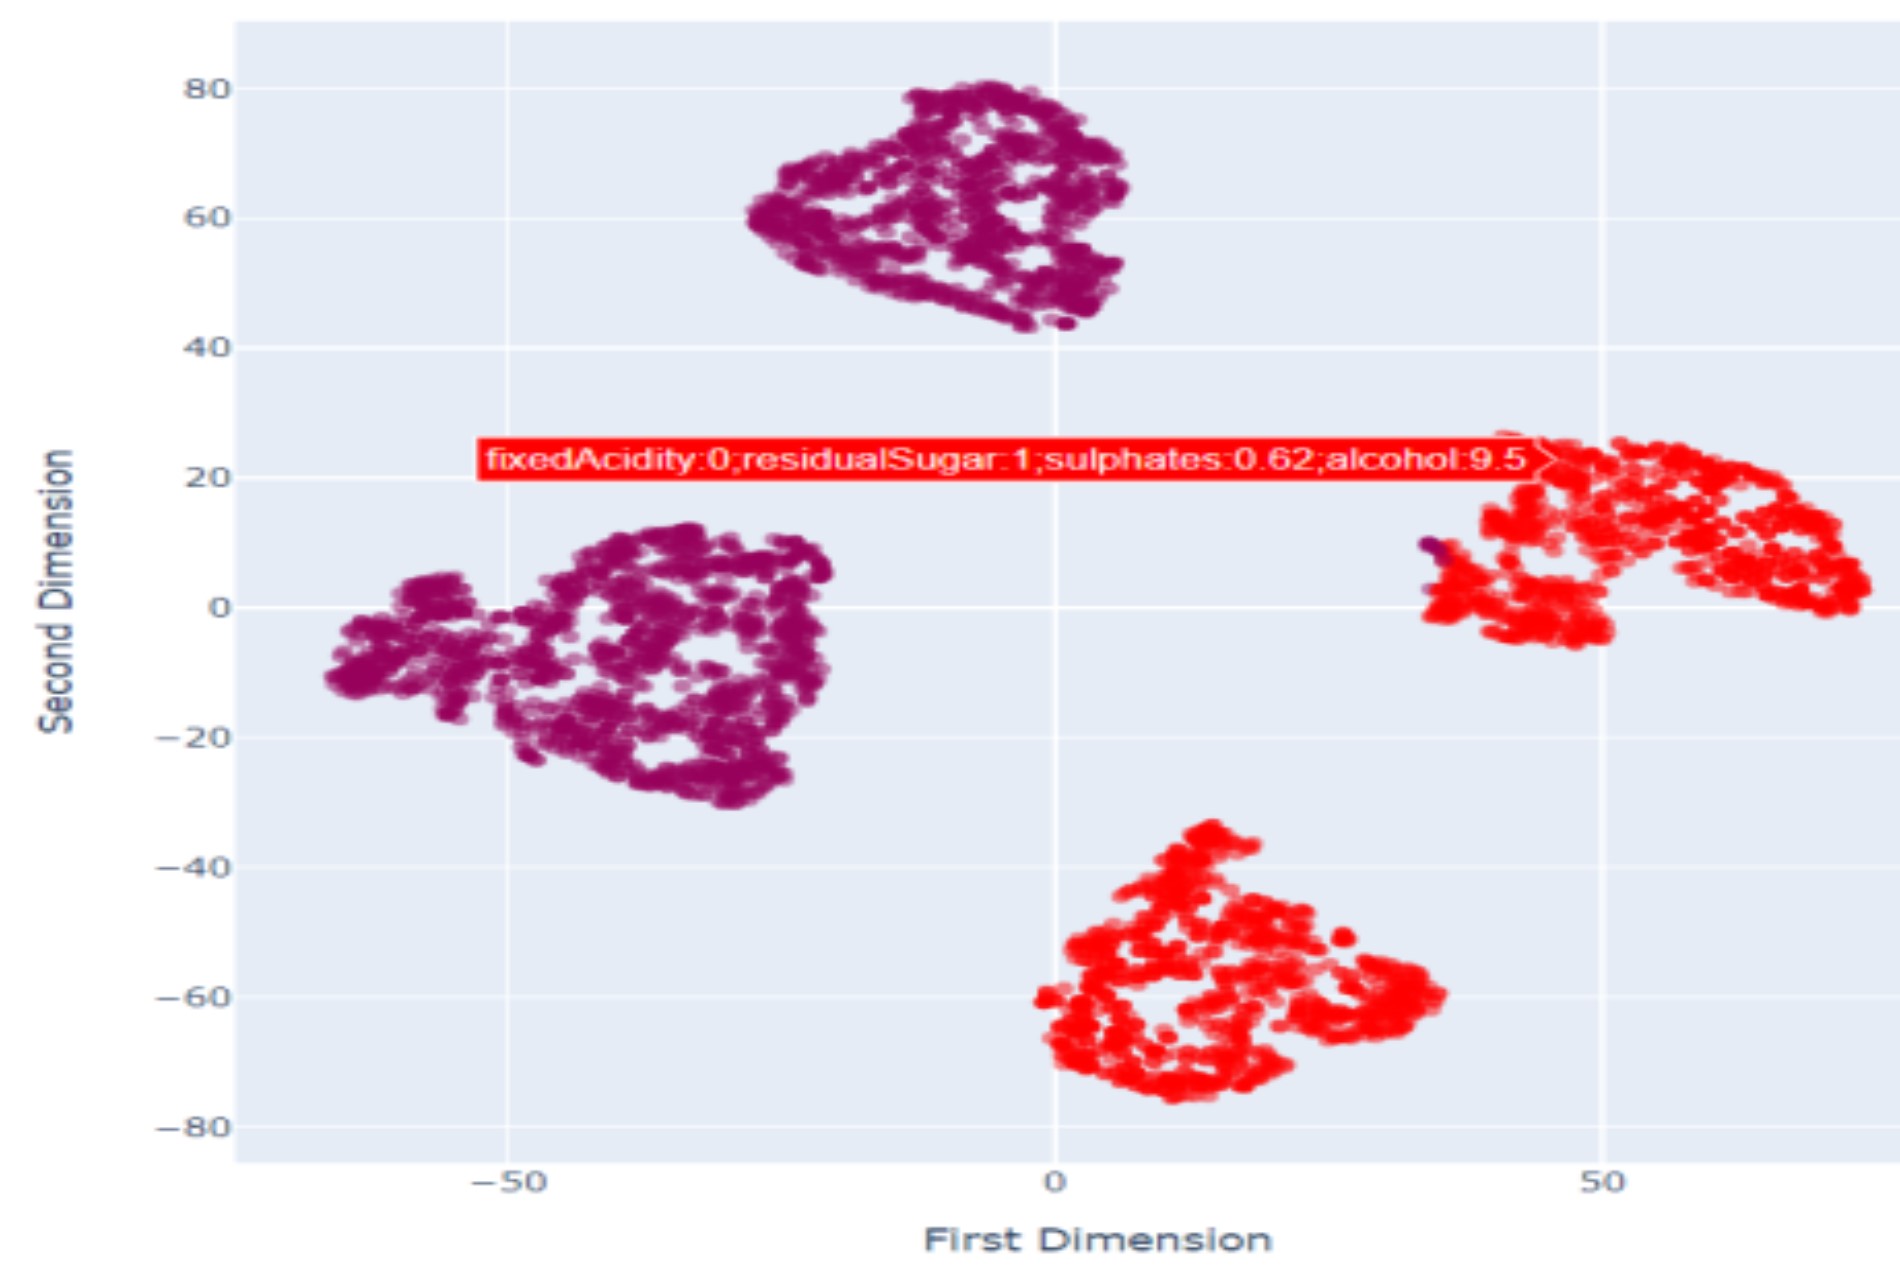
Subset2 – Fixed Acidity, Alcohol, Residual Sugar, Sulphates,
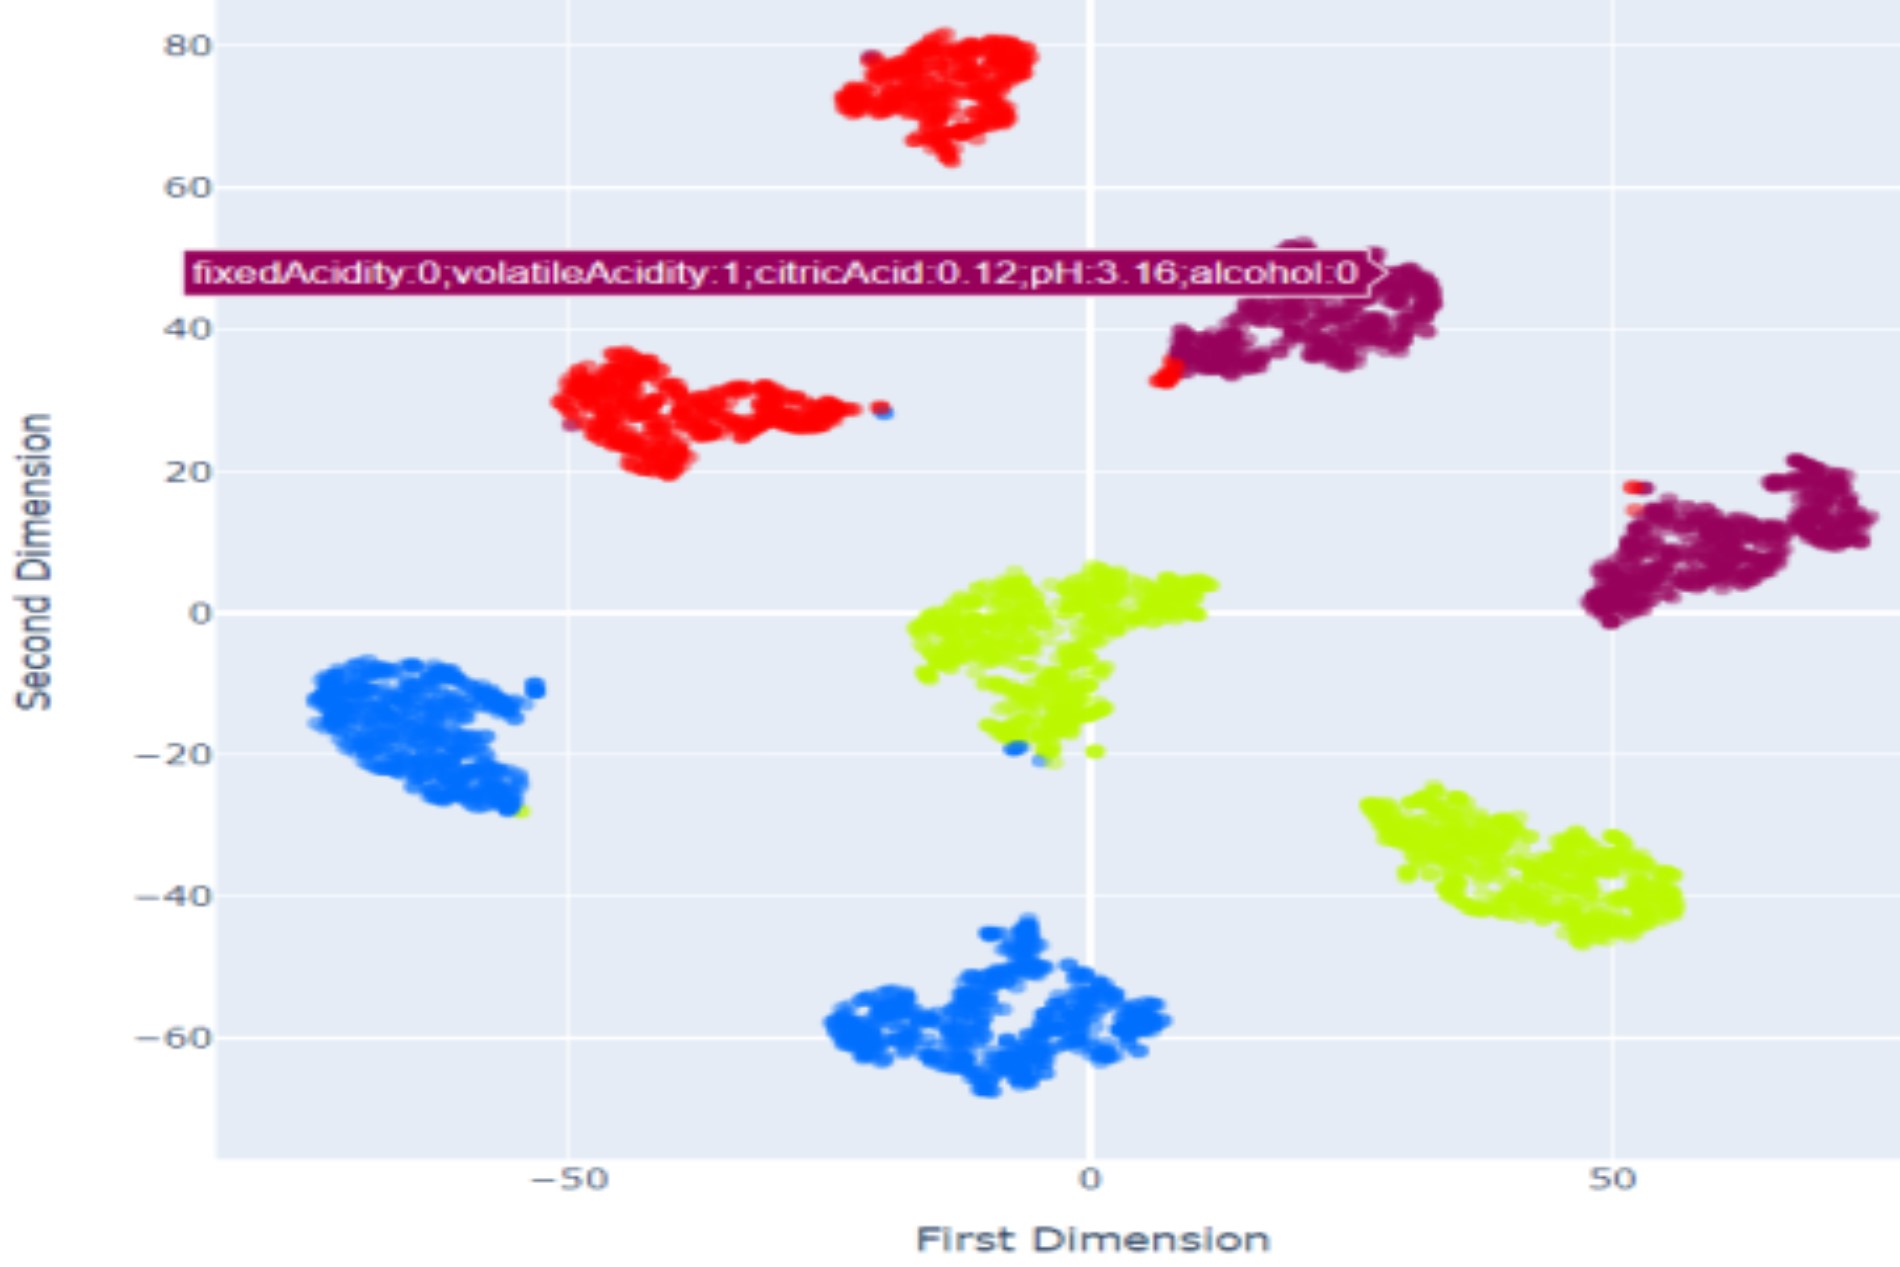
Subset3 – Fixed Acidity, Alcohol, Citric Acid, pH, Volatile Acid.
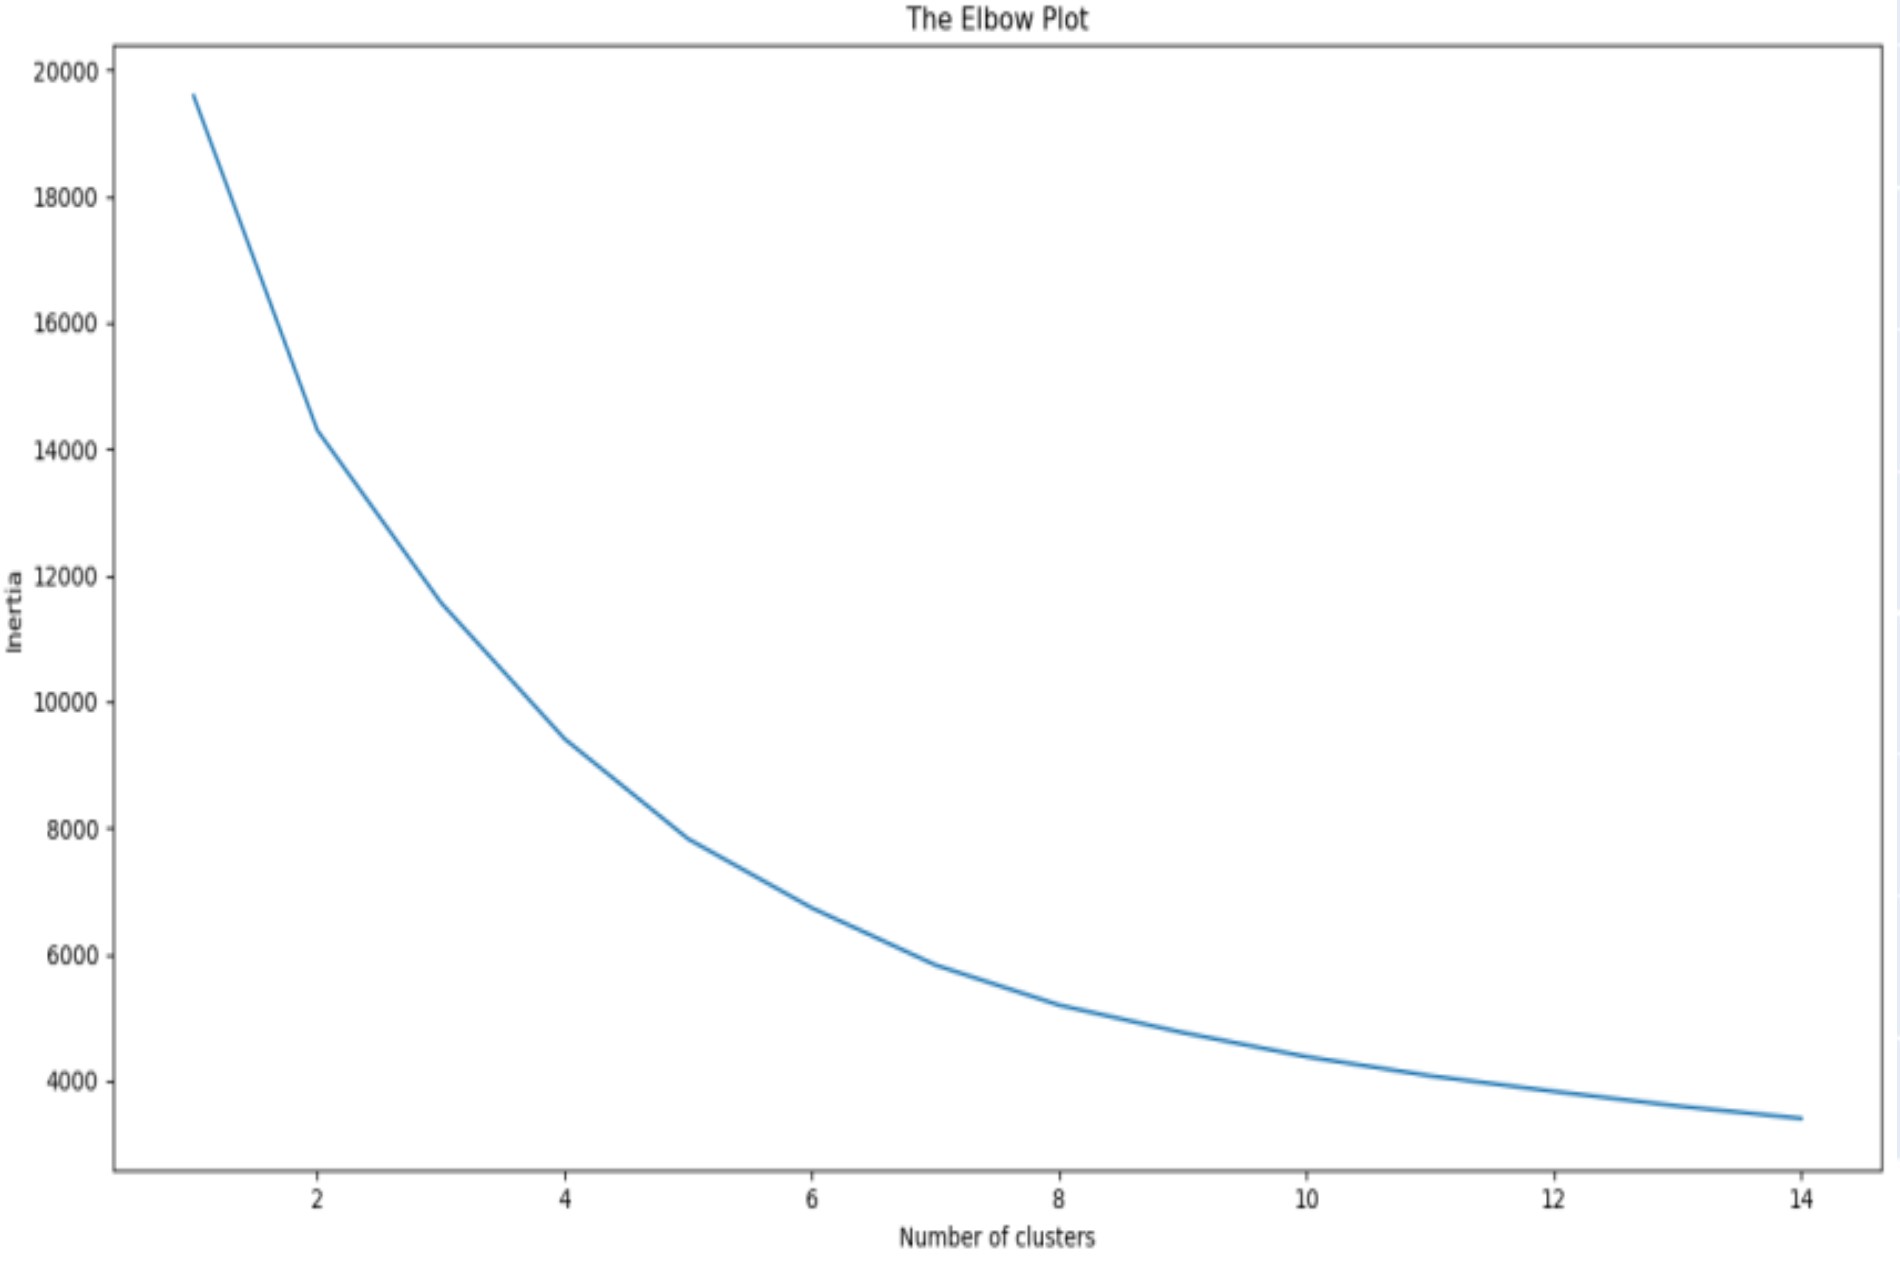
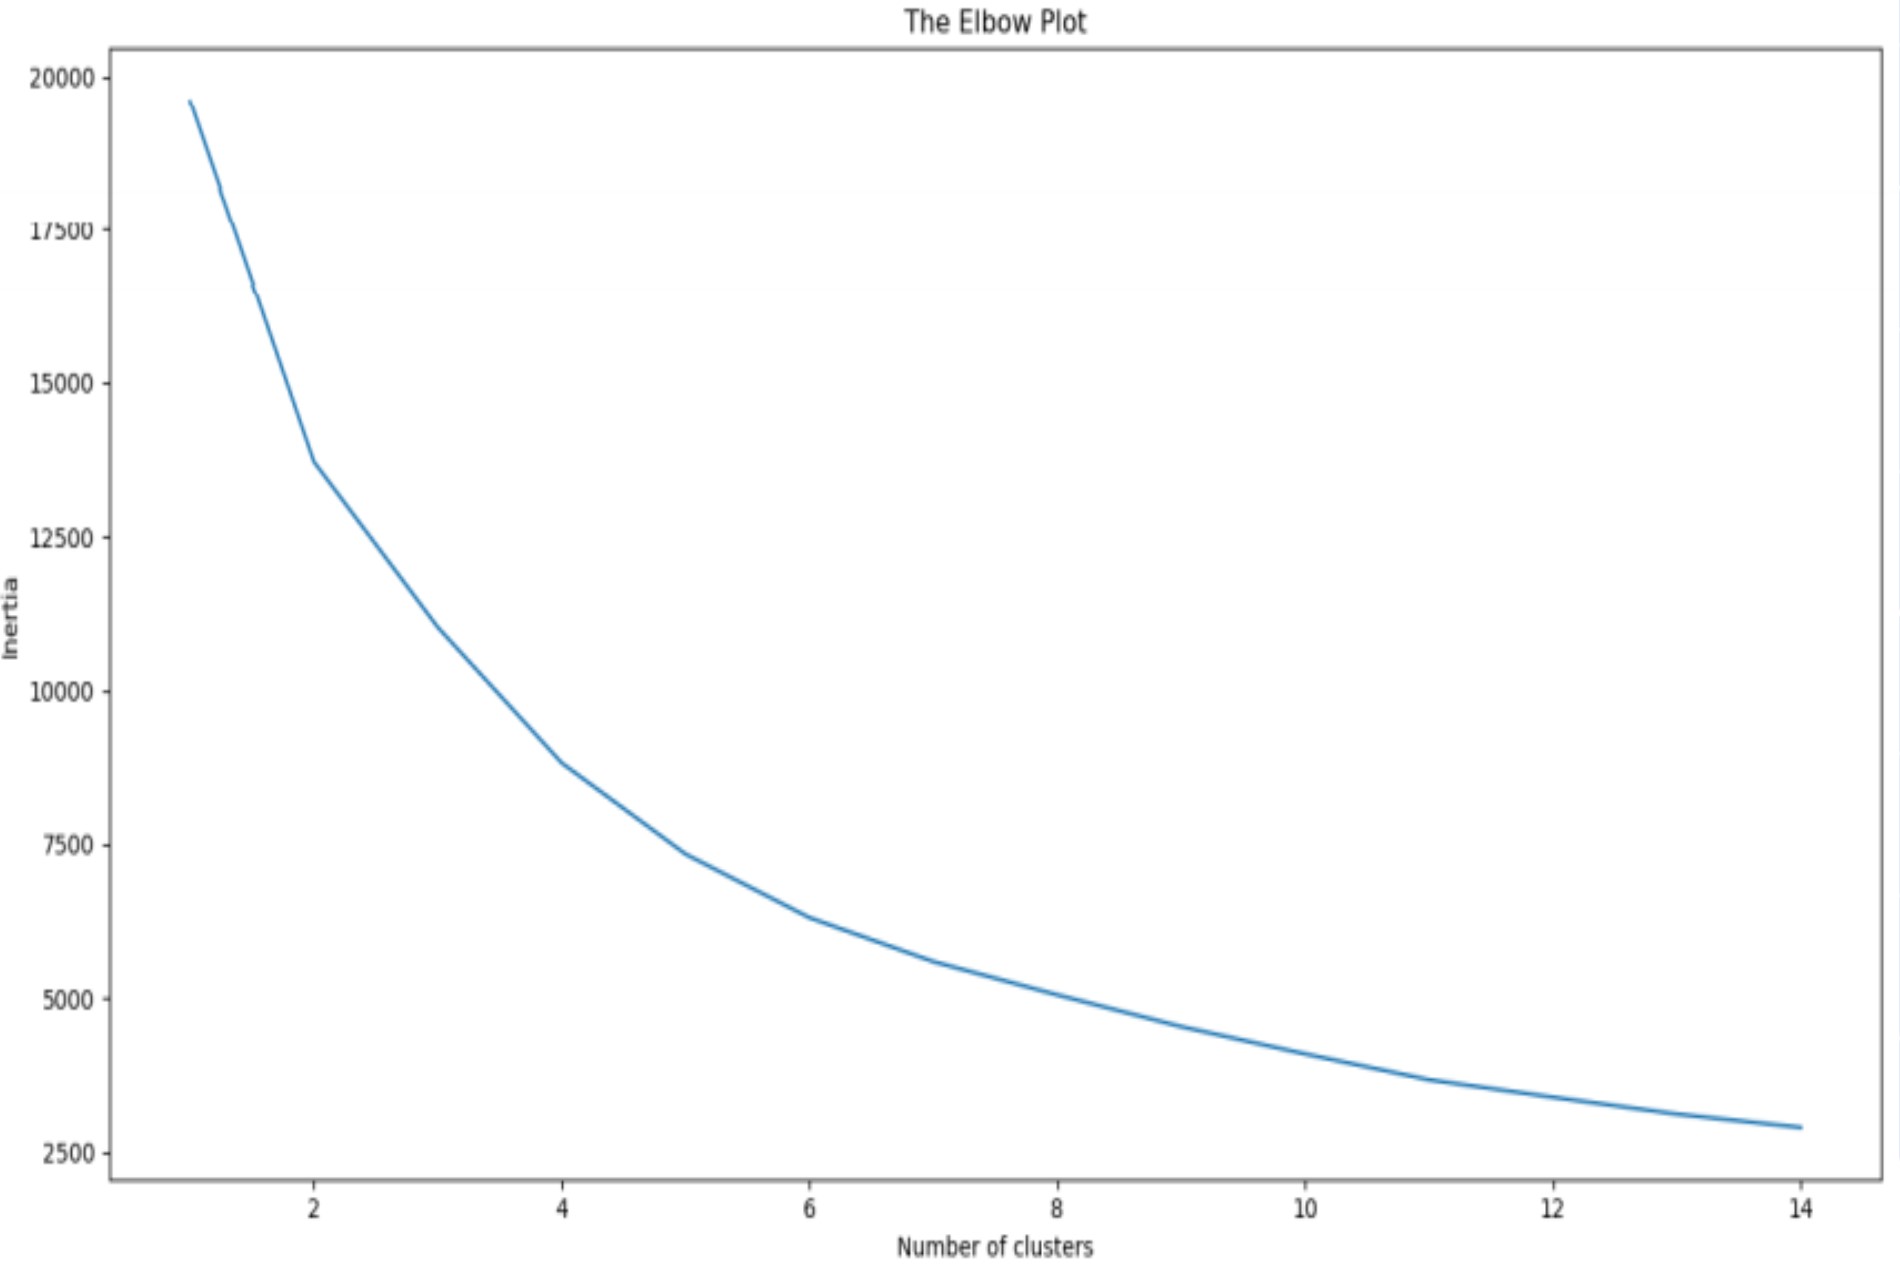
- K-Means implementation for elbow plot. The use of elbow plot is to run k-means clustering
on the dataset for a range of values of k(1 to 10) and for each value of k, calculate the
sum of squared errors(SSE). Then plotting line chart of the SSE for each value
of k.
- The value of k at which improvement in distortion declines the most is called the elbow, at which we
should stop dividing the data into further clusters.
Analysis and Findings
Yellow - citric acid < 0.33(0) and volatile acidity(0) <= 0.27
Blue – citric acid < 0.33(0) and volatile acidity(1) > 0.27
Red – citric acid >= 0.33(1) and volatile acidity(1) > 0.27
Purple – citric acid(1) >= 0.33 and volatile acidity(0) <= 0.27
| Color | Label | Citric Acid | Volatile Acicdity |
|---|---|---|---|
| Yellow | Y | 0 | 0 |
| Blue | B | 0 | 1 |
| Red | R | 1 | 1 |
| Purple | P | 1 | 0 |
Red1 - fixed acidity(1) >= 6.85 and residual sugar(1) >= 6.20
Red2 – fixed acidity(0) < 6.85 and residual sugar(1) >= 6.20
Purple1 – fixed acidity(1) >=6.85 and residual sugar(0) < 6.20
Purple2 – fixed acidity(0) < 6.85 and residual sugar(0) < 6.20
| Color | Label | Fixed Acidity | Residual Sugar |
|---|---|---|---|
| Red | S2R1 | 1 | 1 |
| S2R2 | 0 | 1 | |
| Purple | S2P1 | 1 | 0 |
| S2P2 | 0 | 0 |
Red1 – fixed acidity(1) >= 6.85 volatile acidity(1) > 0.27 alcohol(1) >=10.5
Red2 – fixed acidity(1) >=6.85 volatile acidity(1) > 0.27 alcohol(0) < 10.5
Purple1 – fixed acidity(0) < 6.85 volatile acidity(1) >0.27 alcohol(0) < 10.5
Purple2 – fixed acidity(0) < 6.85 volatile acidity(1) >0.27 alcohol(1)>=10.5
Yellow1 – fixed acidity(0) < 6.85 volatile acidity(0) <= 0.27 alcohol(0) < 10.5
Yellow2 – fixed acidity(0) < 6.58 volatile acidity(0) <=0.27 alcohol(1) >= 10.5
Blue1 – fixed acidity(1) >=6.85 volatile acidity(0) <=0.27 alcohol(1) >= 10.5
Blue2 – fixed acidity(1) >=6.85 volatile acidity(0) <=0.27 alcohol(0) < 10.5
| Color | Label | Fixed Acidity | Volatile Acidity | Alcohol |
|---|---|---|---|---|
| Red | S3R1 | 1 | 1 | 1 |
| S3R2 | 1 | 1 | 0 | |
| Purple | S3P1 | 0 | 1 | 0 |
| S3P2 | 0 | 1 | 1 | |
| Yellow | S3Y1 | 0 | 0 | 0 |
| S3Y2 | 0 | 0 | 1 | |
| Blue | S3B1 | 1 | 0 | 1 |
| S3B2 | 1 | 0 | 0 |
Payment Type v/s Region
Payment Type v/s Region
Payment Type v/s Region
Payment Type v/s Region
Payment Type v/s Region